.png)
The word “foreclosure” can strike fear into any homeowner’s heart—but it’s also a powerful signal for investors, real estate agents, and economists. If you’ve been wondering where the housing market is heading or if you’re thinking about buying or selling, the U.S. foreclosure map is one tool you absolutely need to see.
Let’s break it down—what it shows, why it matters, and how you can use it to make smarter real estate decisions.
What Is a Foreclosure?
How Foreclosures Happen
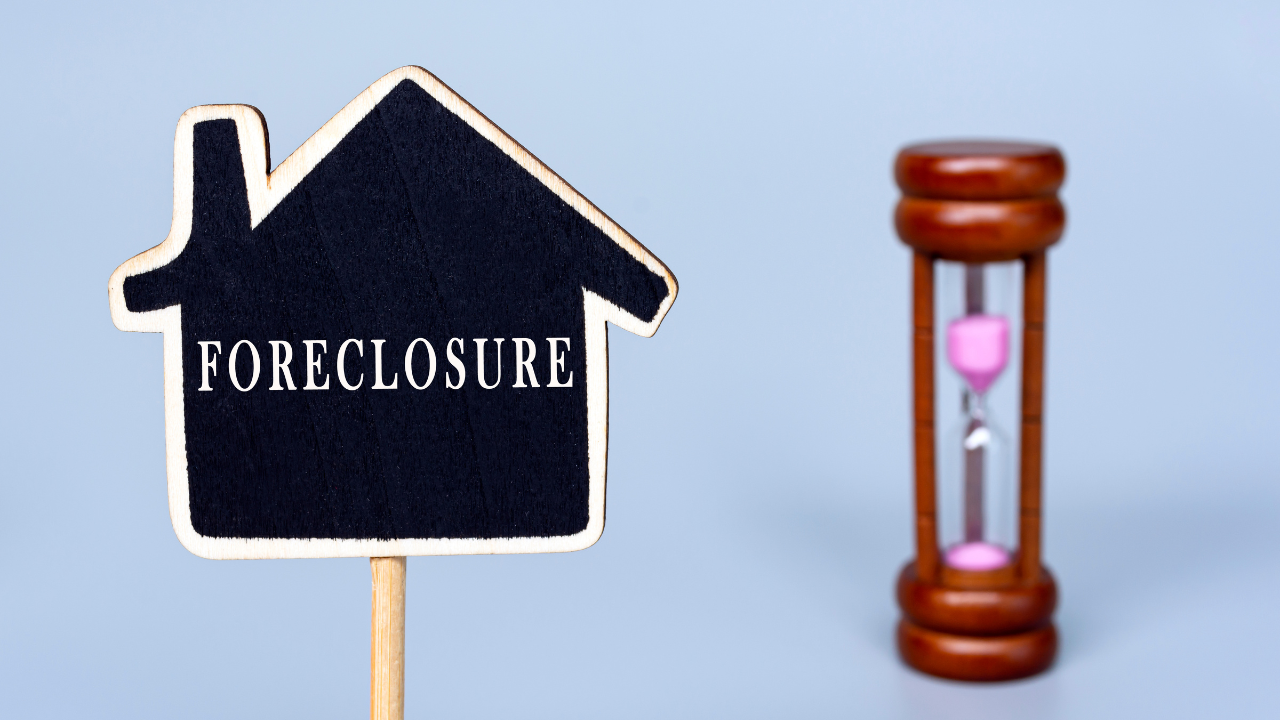
Foreclosure happens when a homeowner can’t keep up with mortgage payments, and the lender seizes the property to recoup losses. It's like the bank hitting a reset button—but that button comes with serious consequences.
Types of Foreclosures
There are generally two types:
- Judicial Foreclosures: These go through the court system. Most common in states like Florida and New York.
- Non-Judicial Foreclosures: Faster and less expensive, these happen without court involvement (think California and Texas).
Why Foreclosure Data Matters

Economic Health Indicator
Foreclosures are a telltale sign of economic stress. Rising numbers can indicate job loss, rising interest rates, or widespread financial instability.
Impact on Homeowners and Neighborhoods
Foreclosed homes often sit empty, lowering neighborhood property values. They can also create blight, crime risks, and strain local resources.
Understanding the U.S. Foreclosure Map
How the Map Is Built
The foreclosure map aggregates county-level data from:
- Mortgage lenders
- Public property records
- Realty tracking services
It’s color-coded for clarity—red = high foreclosures, green = low.
Where the Data Comes From
Reliable sources include:
- ATTOM Data Solutions
- RealtyTrac
- HUD and local government offices
Together, they give you a real-time snapshot of where trouble is brewing—or cooling off.
Current Foreclosure Trends in the U.S.

States with the Highest Foreclosures
In 2025, the usual suspects are still on top:
- Illinois
- New Jersey
- Delaware
- South Carolina
- Florida
These states consistently rank due to a mix of economic pressures and lengthy judicial processes.
States with the Lowest Foreclosures
On the flip side, states like:
- North Dakota
- South Dakota
- Vermont
- Montana
...see fewer foreclosures due to smaller populations and stronger employment rates.
The 5 Most Affected States (2025 Update)
1. Illinois
With a foreclosure rate of 1 in every 2,100 homes, Illinois tops the chart. Urban centers like Chicago are especially hard hit.
2. New Jersey
New Jersey’s judicial foreclosure process creates long timelines, which inflates active foreclosure numbers.
3. Delaware
A small state with big problems—Delaware struggles with low inventory, stagnant wages, and tight credit.
4. South Carolina
Tourism can’t offset the instability in local employment and housing affordability in cities like Columbia and Charleston.
5. Florida
While booming in real estate, Florida still deals with older foreclosure cases and income inequality.
Hidden Foreclosure Hotspots
Suburban vs. Urban Divide
Foreclosures aren't just a big-city issue. In fact, some suburban and rural counties are facing rapid upticks as housing prices rise and wages fail to keep pace.
The Role of Job Loss and Inflation
If an area loses a major employer or faces surging inflation, it can quickly shift from stable to “red zone” on the map.
How to Use the Foreclosure Map Effectively
For Buyers: Opportunity or Risk?
Buying a foreclosed home can mean serious savings—but also major repair costs. Use the map to find deals, but always inspect before you invest.
For Sellers: Market Warning Signs
If your county’s foreclosure rate is climbing, that could mean lower property values or slower sales ahead. Time to rethink your pricing strategy.
Tools and Resources for Navigating Foreclosures

Online Platforms and County Records
Want to dig deeper? Use platforms like:
- Zillow Foreclosure Listings
- Foreclosure.com
- County Clerk websites
They offer filters by price, status, and zip code.
Real Estate Agents and Legal Help
Working with an experienced agent and, if needed, a foreclosure attorney can help you navigate the complexities and avoid costly missteps.
Tips to Avoid Foreclosure
Know Your Mortgage Terms
Before signing anything, understand what happens if rates change or you hit a rough patch. Fixed vs. variable can be the difference between peace of mind and financial panic.
Communicate with Your Lender Early
If you’re struggling, don’t ghost your lender. Many offer temporary forbearance, repayment plans, or refinancing options.
Consider Loan Modification Programs
Government-backed initiatives like HAMP (Home Affordable Modification Program) or FHA loss mitigation programs can reduce your payment and keep you in your home.
Conclusion
The U.S. foreclosure map isn’t just for economists or real estate pros—it’s a powerful visual tool for anyone who wants to stay ahead of housing trends. Whether you're buying your first home, watching out for market crashes, or just curious, this map can tell you a lot about the American financial pulse.
Don't ignore the red zones. Use them as signposts—and start making informed moves today.
FAQs
1. How often is the foreclosure map updated?
Most reliable maps update monthly, but top platforms may offer weekly refreshes using public and proprietary data.
2. Can I buy a home directly from a foreclosure map?
Not directly. But the map shows areas with high foreclosure activity—then you can search those areas on real estate platforms.
3. Are foreclosures cheaper than traditional homes?
Yes, often by 10–30%. But factor in repairs, legal costs, and possible delays.
4. Is it risky to invest in high-foreclosure areas?
It depends. High foreclosure rates may mean deals—but also unstable markets. Do your homework and assess neighborhood trends.
5. Can I prevent foreclosure once it starts?
Absolutely. Early communication with your lender and exploring loan modifications or refinancing can often stop the process.